Heart rate variability (HRV) on Apple Watch ECG
Your heart rate variability (HRV) is one of the most useful signals your Apple Watch ECG can give you about how your body is coping, but only if you read it the right way. Here's what HRV is, how ECG+ calculates it from your recording, and why your trend matters far more than any single number.
What is HRV?
HRV is the measure of the subtle changes in timing between each of your heartbeats. Even at a steady 60 beats per minute, your heart doesn't tick like a clock, one beat might land 950 milliseconds after the last, and the next 1,050 milliseconds later. That natural beat-to-beat variation is HRV.
It's controlled by your autonomic nervous system, the "autopilot" that runs your heart rate, breathing and digestion without conscious thought. It has two sides: the parasympathetic ("rest and digest"), which slows the heart, and the sympathetic ("fight or flight"), which speeds it up. HRV reflects the balance between them:
- Higher HRV usually signals a flexible, adaptable system that switches smoothly between rest and activity, often seen in fitter, well-rested people.
- Lower HRV can mean your body is working harder to cope, under stress, poorly rested, dehydrated, or fighting off illness.
HRV is sensitive enough that a noticeable drop has been observed in people days before they feel symptoms of an infection, the body reacting to strain early.
How ECG+ calculates HRV from your Apple Watch ECG
Your Apple Watch records a single-lead ECG. ECG+ reads that recording, detects the R peak of every heartbeat, and measures the time between consecutive beats, the RR intervals. HRV is then calculated from how much those intervals vary across the recording, using standard time-domain measures:
- RMSSD: the root mean square of successive differences between beats; it captures fast, beat-to-beat changes and closely reflects parasympathetic ("rest and digest") activity.
- SDNN: the standard deviation of the beat intervals; a broader picture of overall variability.
Because an Apple Watch ECG is a short (about 30-second) recording, each reading is a snapshot of your HRV at that moment, which is exactly why the trend across many readings matters more than any one of them.
Reading your HRV Poincaré plot
Alongside the numbers, ECG+ can show your variability as a Poincaré plot: a simple but powerful way to see your HRV at a glance. Each dot plots one heartbeat's RR interval against the very next one: its horizontal position is how long one beat took, and its vertical position is how long the following beat took. Plot every pair from the recording and you get a cloud of dots.
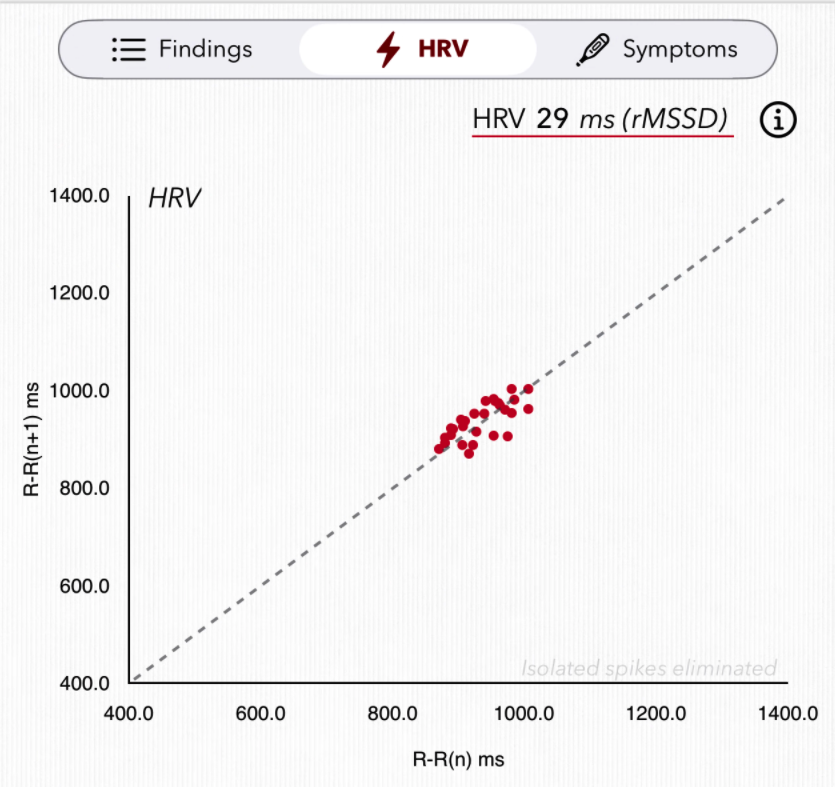
In ECG+, each red dot pairs one heartbeat with the next. A looser, more spread-out cloud means higher HRV: this reading shows 29 ms (RMSSD).
The shape and spread of the cloud is what tells the story:
- A spread-out cloud: consecutive beats differ more from one another, so HRV is higher; a sign of a flexible, adaptable rhythm.
- A tight, clustered cloud: consecutive beats are very similar, so HRV is lower; a more "metronome-like" rhythm.
- The diagonal line: dots sit on it when each beat closely matches the one before. The further they scatter away from it, the more beat-to-beat variation there is.
- Stray outliers: a lone dot far from the cloud usually marks a premature beat, a PAC or PVC, rather than true variability.
Because the plot is built from the same RR intervals as RMSSD and SDNN, it's a visual companion to those numbers: the wider the cloud, the higher the RMSSD. It turns a single 30-second snapshot into something you can read at a glance, though, as with the numbers, your trend across many readings is what matters most.
Why the trend matters more than the number
There is no universal "good" HRV. Healthy values vary enormously from person to person, and HRV naturally falls with age and rises with fitness. A number that's normal for one person could be high or low for another, so comparing your HRV to someone else's tells you very little.
What's genuinely informative is your own HRV over time. Tracked across days and weeks, a steady reading is reassuring, a sustained climb suggests improving resilience, and an unexpected dip is an early heads-up that something, stress, poor sleep, dehydration, or illness, is taxing your body. ECG+ records the HRV of every reading so you can watch that line, not chase a single figure. One low reading after a bad night means little; a direction over time means a lot.
What rising or falling HRV means
Rising HRV
A sustained upward trend is an encouraging sign of improving health and resilience: a finely tuned autonomic system, better cardiovascular responsiveness, stronger emotional resilience, and efficient physical recovery. It's commonly seen with good fitness, quality sleep and effective stress management, and is associated with healthier aging. More on rising HRV →
Falling HRV
A downward trend generally suggests your body's ability to manage and recover from stress is becoming compromised, often from inadequate sleep, chronic stress, overtraining, poor fitness or illness, which leave the nervous system out of balance. It's a cue to prioritize rest and recovery. More on falling HRV, and how to raise it →
How to keep a good HRV trend
Supporting HRV is really about supporting your body's resilience and the balance between rest and stress. Small, consistent habits make the biggest difference:
- Move regularly: moderate aerobic exercise (walking, cycling, swimming) plus some resistance training, without overtraining.
- Prioritize sleep: aim for 7–9 hours of consistent, quality sleep; limit screens and afternoon caffeine.
- Breathe and unwind: a few minutes of slow, deep breathing or meditation activates the "rest and digest" system.
- Stay hydrated: steady water intake supports circulation and eases strain on the heart.
- Eat well: whole foods, lean protein and plenty of vegetables; go easy on sugar and processed food.
- Limit alcohol: even a little can lower HRV for days.
- Get outside and rest: time in nature and genuine downtime help the nervous system reset.
Note: on recordings classified as atrial fibrillation, ECG+ hides HRV, an irregular rhythm artificially inflates it and makes it misleading, and shows an irregularity (CV%) value instead. HRV here is for general wellbeing insight and is not a diagnosis; see the disclaimer and talk to your doctor about any health concerns.